Brought to you by SolarWinds
By Sascha Giese, Head Geek, SolarWinds

In today’s hyperconnected digital life, when an app or website malfunctions or appears slow, there is often little time to troubleshoot what is causing, say, the lag in displaying the data or a failure to complete a transaction.
The irony is that today’s apps and systems, built with distributed computing, containers and the cloud, have grown in both complexity and scale, making it a tough job for IT teams to manage and remediate, should an issue occur.
Finding the root cause is often not as simple as pulling up a dashboard that is set up to monitor the network equipment or database performance.
If that shows the problem right away, that’s great, but often, it is a lot more challenging because of the difficulty in gaining enough insights into today’s IT systems.
Apps that are created with microservices are self-contained and sometimes may not show up issues immediately. Public cloud systems running on multi-tenant arrangements may require effort to surface some issues with latency or security, for example.
The key here is actionable insights. A surgeon knows how to operate on a patient with a knee problem, for example, but it would help him greatly if the findings of an MRI (magnetic resonance imaging) are made clear to him by the radiologist, so he knows where the problem is to determine the action to be taken.
Similarly, while IT teams may discover the basic signs of an issue, the data needs to be contextualised for the human operators to better understand and rectify. After all, too many alerts that don’t make sense, lead to alert fatigue and a lack of efficiency as well.
Today, there are useful monitoring tools which enable IT teams to gain visibility into the systems and get alerted, say, when a database is misbehaving.
By grouping some of the tools together, IT teams have found it easier to deduce the cause and effect between different parts of an enterprise with such tools. Plus, relationships between entities in the setup can become more apparent, as the telemetry from the system delivers more insights.
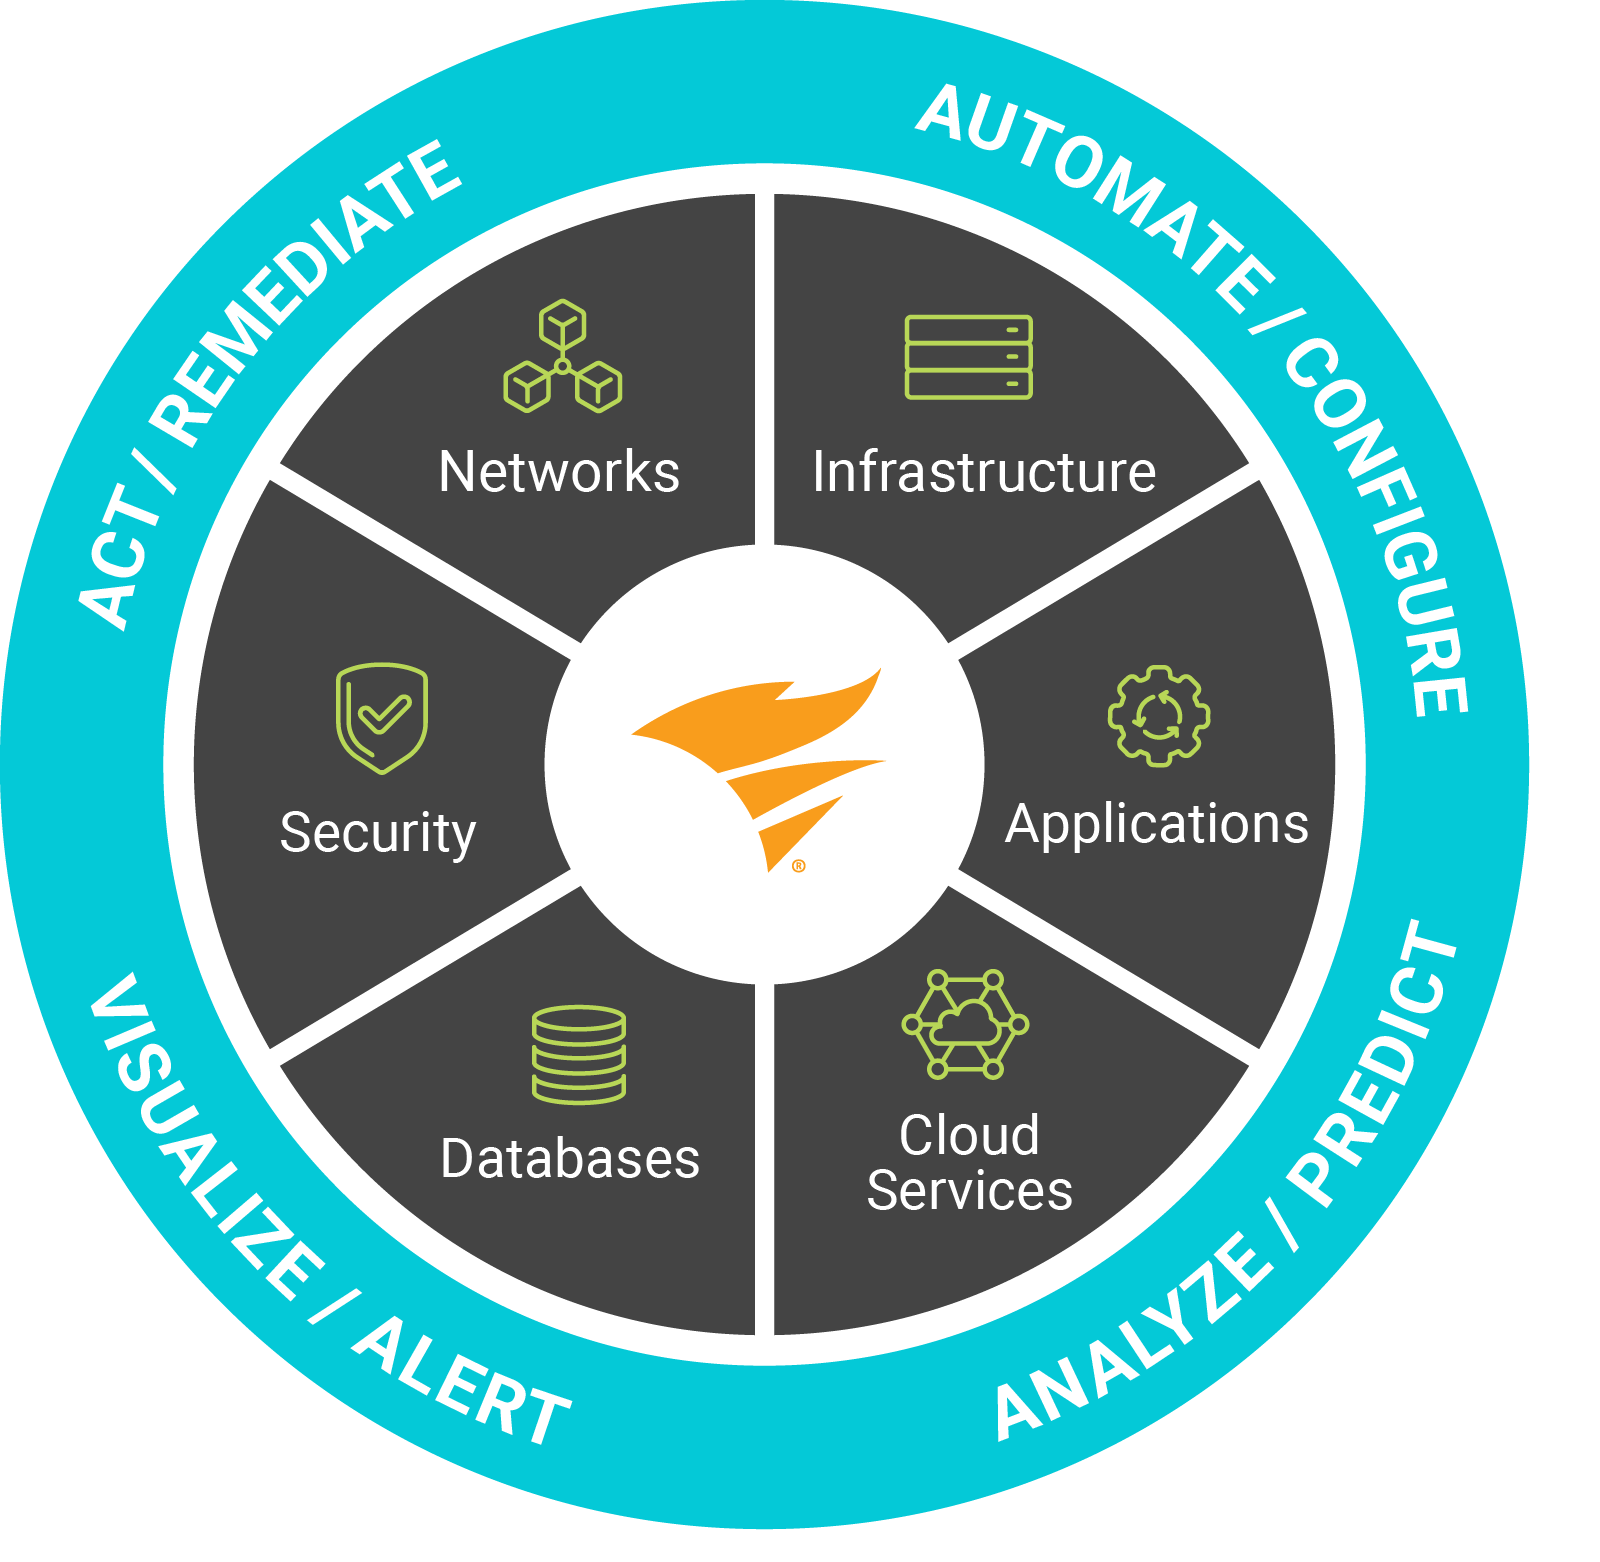
Even this isn’t a silver bullet, though. Although many such monitoring tools promise a single pane of glass for all the important vitals of a system, there are many different moving parts that need to be considered to reap the benefits of Full Stack Observability.
For businesses that are using hybrid clouds, various tools are needed to show the resource usage and how this might impact the digital experience of users.
Application performance monitoring (APM) tools, meanwhile, drill down into the nitty-gritty of how well apps are working in the context of users, for example, response time.
However, many enterprises already have upward of 15 monitoring tools and do not wish to add further complexity, according to research firm Gartner.
Already, ITOps, DevOps, and SecOps teams receive an overload of alerts and disjointed analytics and have difficulty accessing the actionable insights they need to quickly identify, prioritise, and resolve issues in business-critical services, it notes.
These disparate tools can also be cumbersome to implement and manage, and they can become cost-prohibitive to maintain and scale, creating operational and business risks.
What businesses need is a not just the visibility through the logs and metrics from their monitoring tools, but observability. In other words, more actionable intelligence that comes with context and a lot more detail in the data.
Observability may mean different things to different businesses because their requirements are not always the same. Each one may have different workloads and systems that need different sensors or monitoring tools.
However, there is a broad understanding of observability that can be agreed on. System health, for one, should be something observable. Actionable guidance to resolve an issue is another useful feature.
Increasingly, artificial intelligence (AI) will be an important part of observability. AIOps can help manage storage capacity proactively and detect and analyse anomalies in network and application performance to find the root cause anomalies, for example.
These tools will help teams better manage their tasks rather than just alerting them to potential problems.
After all, AI can analyse terabytes of data to spot patterns, something that humans cannot do in the same amount of time or with the same effort, and it can suggest ways to improve performance by finding the root cause much more quickly.
Ultimately, observability is an evolution of the many monitoring tools that already allow businesses to have a sense of how well their apps and systems are doing today.
It takes into account the distributed and more complex setups they run today to deliver digital experiences to users. It does not just monitor the health of systems but also tries to make sense of their external output to help IT teams overcome common issues like poor app performance.
This is critical today because patience is a premium when it comes to digital interactions. When an app is slow to respond, a user won’t ask if it is due to the network, the cloud infrastructure or the software code. That’s for the IT teams to quickly figure out.


